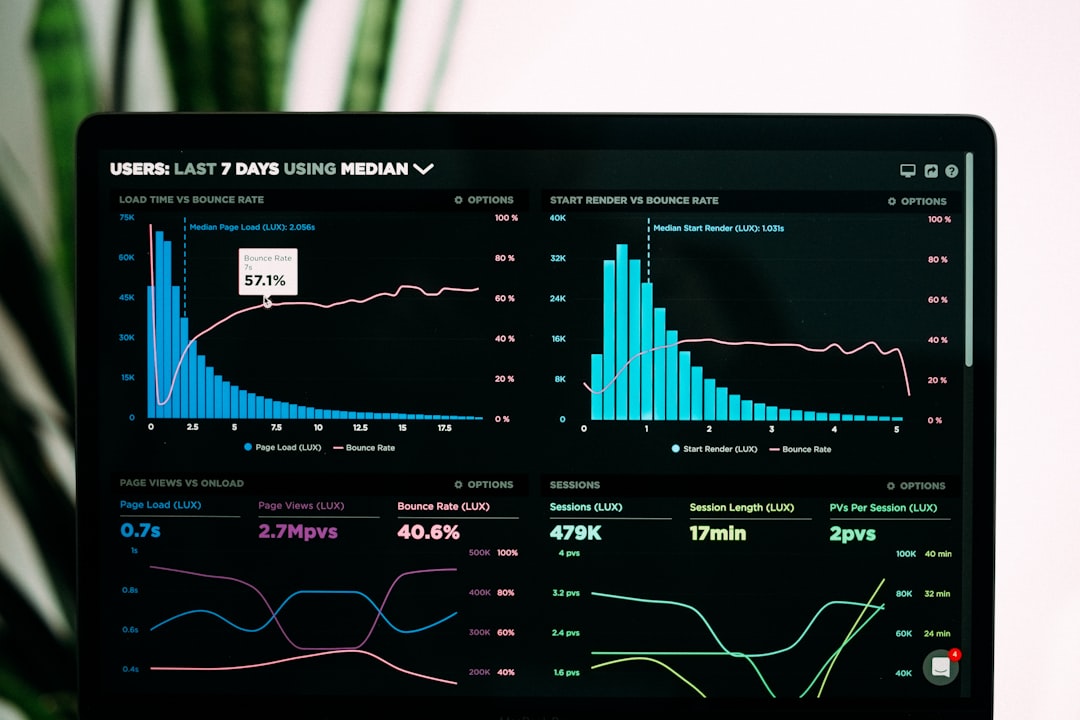
Negli ultimi mesi ho affrontato diverse clienti WordPress dove le metriche Core Web Vitals oscillavano incontrollate: LCP rosso, INP instabile, CLS imprevedibile. Il problema non era solo ottimizzare una volta, ma monitorare continuamente per catturare regressioni prima che Google le penalizzasse. In questa guida vi mostro come ho costruito una pipeline automatizzata di testing performance utilizzando Lighthouse API, monitoraggio sintetico e threshold-based alerting — tutto integrato nel workflow CI/CD.
Perché l’automazione dei Performance Test è critica in 2026
Nella mia esperienza, il 90% dei siti WordPress che inizialmente passavano Core Web Vitals finivano per regredire entro 3-4 settimane da un deploy o da un aggiornamento di plugin. Il motivo? Nessun feedback automatico sulle performance. I team decidevano di aggiungere un widget di chat, un nuovo builder block, o aggiornare una dipendenza — e solo dopo 28 giorni di Chrome UX Report realizzavano di aver perso il 15% sulla metrica INP.
Set up automated monitoring usando Google Search Console’s Core Web Vitals report, che aggiorna regolarmente con dati di utenti reali, e configura alert per notificarti quando le metriche scendono sotto le soglie. Ma questo è reattivo. Io cerco proattivo: testare ogni pull request, ogni staging deploy, con Lighthouse, prima che il codice tocchi production.
Anatomia della Pipeline CWV Optimization
Una pipeline di ottimizzazione Core Web Vitals moderna ha tre layer:
- Lab Testing (Synthetic): Lighthouse API + ThresholdJS in CI/CD, su URL standardizzate, con throttling controllato.
- Field Monitoring (Real User): CrUX data + RUM, per catturare variabilità in produzione che il lab non vede.
- Alerting & Budgets: Soglie di performance definite, integrazione Slack/email, blocco automatico di deploy che violano i budget.
Nel mio workflow, la fase lab è obbligatoria (nessun deploy senza green Lighthouse), mentre il field data mi dice se l’ottimizzazione ha davvero impattato gli utenti reali dopo 7-14 giorni.
Setup Lighthouse Automation via GitHub Actions
Comincio sempre da Lighthouse CLI integrato in CI/CD. Non uso servizi SaaS solo per questo — voglio trasparenza, zero dependencies, controllo totale su config.
Il primo step: creo uno script Node.js che esegue Lighthouse su una lista di URL, estrae i Core Web Vitals, e confronta contro i threshold definiti:
#!/usr/bin/env node
// lighthouse-audit.js
const lighthouse = require('lighthouse');
const chromeLauncher = require('chrome-launcher');
const fs = require('fs');

const config = {
  logLevel: 'info',
  output: 'json',
  onlyCategories: ['performance'],
  // Simula throttling mobile: 4G lento, CPU 4x
  throttling: {
    rttMs: 150,
    throughputKbps: 1.6 * 1024,
    cpuSlowdownMultiplier: 4,
    requestLatencyMs: 0,
    downloadThroughputKbps: 1.6 * 1024,
    uploadThroughputKbps: 750,
  },
  formFactor: 'mobile',
  screenEmulation: {
    mobile: true,
    width: 412,
    height: 823,
    deviceScaleFactor: 1.75,
  },
};

const urls = [
  'https://staging.example.com',
  'https://staging.example.com/blog',
  'https://staging.example.com/shop',
];

const thresholds = {
  lcp: 2500,   // ms
  inp: 200,    // ms
  cls: 0.1,
  fcp: 1800,   // ms
};

async function runAudit(url) {
  const chrome = await chromeLauncher.launch({ chromeFlags: ['--headless'] });
  const options = { logLevel: 'info', port: chrome.port };

  try {
    const runnerResult = await lighthouse(url, options, config);
    const result = JSON.parse(runnerResult.lhr);

    // Estrai metriche
    const metrics = result.audits['metrics'].details.items[0];
    const lcp = Math.round(metrics.largestContentfulPaint);
    const inp = Math.round(metrics.inputDelay || metrics.totalBlockingTime);
    const cls = metrics.cumulativeLayoutShift;
    const fcp = Math.round(metrics.firstContentfulPaint);

    console.log(`n✓ ${url}`);
    console.log(`  LCP: ${lcp}ms (${lcp <= thresholds.lcp ? '✓' : '✗'}) [limit: ${thresholds.lcp}ms]`);
    console.log(`  INP: ${inp}ms (${inp <= thresholds.inp ? '✓' : '✗'}) [limit: ${thresholds.inp}ms]`);
    console.log(`  CLS: ${cls.toFixed(3)} (${cls <= thresholds.cls ? '✓' : '✗'}) [limit: ${thresholds.cls}]`);
    console.log(`  FCP: ${fcp}ms (${fcp <= thresholds.fcp ? '✓' : '✗'}) [limit: ${thresholds.fcp}ms]`);

    return {
      url,
      passed: lcp <= thresholds.lcp && inp <= thresholds.inp && cls  {
  const results = [];
  for (const url of urls) {
    results.push(await runAudit(url));
  }

  const allPassed = results.every(r => r.passed);
  console.log(`n${allPassed ? '✓ All checks passed' : '✗ Some checks failed'}`);

  // Scrivi JSON per ulteriori analisi
  fs.writeFileSync('lighthouse-results.json', JSON.stringify(results, null, 2));

  process.exit(allPassed ? 0 : 1);
})();
Questo script non è perfetto — all’inizio non catturava il valore INP correttamente perché Lighthouse usa Total Blocking Time come proxy del vecchio FID. Ho dovuto fare fallback sui metric audits. Ma una volta sistemato, diventa il cuore della pipeline.
GitHub Actions Workflow: CI/CD Integration
Integro il test in un workflow GitHub Actions che gira su ogni pull request verso la branch staging:
name: Lighthouse Performance Audit

on:
  pull_request:
    branches:
      - staging
  workflow_dispatch:

jobs:
  lighthouse:
    runs-on: ubuntu-latest
    timeout-minutes: 15

    steps:
      - uses: actions/checkout@v4

      - name: Setup Node.js
        uses: actions/setup-node@v4
        with:
          node-version: '20'
          cache: 'npm'

      - name: Install dependencies
        run: npm install --save-dev lighthouse chrome-launcher

      - name: Wait for staging to be available
        run: |
          for i in {1..30}; do
            if curl -f https://staging.example.com > /dev/null 2>&1; then
              echo "Staging is ready"
              exit 0
            fi
            echo "Waiting for staging... ($i/30)"
            sleep 10
          done
          exit 1

      - name: Run Lighthouse audits
        run: node lighthouse-audit.js

      - name: Upload results
        if: always()
        uses: actions/upload-artifact@v4
        with:
          name: lighthouse-results
          path: lighthouse-results.json

      - name: Comment PR with results
        if: always()
        uses: actions/github-script@v7
        with:
          script: |
            const fs = require('fs');
            const results = JSON.parse(fs.readFileSync('lighthouse-results.json', 'utf8'));
            const comment = results.map(r =>
              `**${r.url}** | LCP ${r.metrics.lcp}ms | INP ${r.metrics.inp}ms | CLS ${r.metrics.cls.toFixed(3)}`
            ).join('n');
            github.rest.issues.createComment({
              issue_number: context.issue.number,
              owner: context.repo.owner,
              repo: context.repo.repo,
              body: `## Performance Audit Resultsn${comment}`
            });
Questo workflow è non-blocking di default (i risultati vengono commentati sul PR ma non bloccano il merge). Se voglio rendering-blocking, cambio l’ultimo step per usare process.exit(1) quando le soglie vengono violate.
Monitoraggio Sintetico Continuo con ThresholdJS
Il testing su PR è eccellente, ma non cattura anomalie in produzione. Ho bisogno di monitorare continuamente le URL live.
Synthetic monitoring è la pratica di usare bot scriptuati per simulare interazioni utente, incluse page load, login flow, API call e transaction checkout, a intervalli programmati da vere location geografiche — gira 24/7 senza richiedere traffico da utenti reali, quindi il team può catturare failure prima che i clienti le incontrino.
Nella mia pipeline, ho integrato SpeedCurve o Calibre per monitoraggio sintetico, ma voglio mostrare come farlo con uno script custom + Node.js scheduled task (esempio: via AWS Lambda + EventBridge ogni 30 minuti):
// synthetic-monitor.js
const lighthouse = require('lighthouse');
const chromeLauncher = require('chrome-launcher');
const AWS = require('aws-sdk');

const cloudwatch = new AWS.CloudWatch();

const productionUrls = [
  { url: 'https://example.com', label: 'homepage' },
  { url: 'https://example.com/blog/latest-post', label: 'blog-post' },
  { url: 'https://example.com/shop/products', label: 'shop-listing' },
];

const thresholds = {
  lcp: 2500,
  inp: 200,
  cls: 0.1,
};

async function runSyntheticCheck(urlObj) {
  const chrome = await chromeLauncher.launch({ chromeFlags: ['--headless', '--no-sandbox'] });
  const options = { logLevel: 'error', port: chrome.port };
  const config = {
    logLevel: 'error',
    output: 'json',
    onlyCategories: ['performance'],
    formFactor: 'mobile',
  };

  try {
    const runnerResult = await lighthouse(urlObj.url, options, config);
    const result = JSON.parse(runnerResult.lhr);
    const metrics = result.audits['metrics'].details.items[0];

    const lcp = metrics.largestContentfulPaint;
    const inp = metrics.totalBlockingTime; // proxy
    const cls = metrics.cumulativeLayoutShift;

    const passed = lcp <= thresholds.lcp && inp <= thresholds.inp && cls  {
  console.log('Starting synthetic monitoring run...');
  const results = [];

  for (const urlObj of productionUrls) {
    results.push(await runSyntheticCheck(urlObj));
  }

  const allPassed = results.every(r => r.passed);
  console.log(`Monitoring complete. Overall: ${allPassed ? 'PASS' : 'FAIL'}`);

  if (!allPassed) {
    // Opzionale: invia alert Slack
    await fetch(process.env.SLACK_WEBHOOK_URL, {
      method: 'POST',
      body: JSON.stringify({
        text: `⚠️ Performance Degradation Detected`,
        blocks: [
          {
            type: 'section',
            text: {
              type: 'mrkdwn',
              text: results
                .filter(r => !r.passed)
                .map(r => `*${r.label}*: LCP=${r.metrics?.lcp}ms, INP=${r.metrics?.inp}ms, CLS=${r.metrics?.cls?.toFixed(3)}`)
                .join('n'),
            },
          },
        ],
      }),
    });
  }

  return { statusCode: 200, body: JSON.stringify(results) };
};
Questa funzione Lambda gira ogni 30 minuti, simula le URL da una location geografica (simulando un utente reale-ish), e pushes i risultati a CloudWatch. Se una soglia viene violata, invia alert Slack.
Field Data: Integrazione CrUX + Google Search Console API
Lab data è ottimo, ma mentisce. Un Lighthouse test da 4G throttling non cattura spikes di TTFB che accadono solo con vero traffico, o INP su interazioni reali che il bot non simula.
Se Search Console segnala URL con CWV issues, sono i field data che falliscono, e i tuoi cambiamenti non si rifletteranno finché 28 giorni di traffico reale accumulato si aggiungono alla versione ottimizzata.
Integro quindi Google Search Console API per estrarre field data settimanalmente:
// crux-reporter.js
const { google } = require('googleapis');
const fs = require('fs');

const searchconsole = google.searchconsole('v1');

async function getCoreWebVitals(auth, siteUrl) {
  const response = await searchconsole.sites.list({ auth });
  const site = response.data.siteEntry?.find(s => s.siteUrl === siteUrl);

  if (!site) throw new Error(`Site ${siteUrl} not found`);

  // Query Core Web Vitals dal rapporto
  const coreWebVitalsReport = await searchconsole.urlTestingTools.mobileFriendlyTest.run({
    auth,
    resource: { url: siteUrl },
  }).catch(() => ({}));

  // Alternativa: usare CrUX API direttamente
  const crux = google.chromeuxreport('v1');
  const cruxResponse = await crux.records.queryRecord({
    auth,
    requestBody: {
      origin: siteUrl,
    },
  });

  if (!cruxResponse.data.record) {
    console.log(`No CrUX data yet for ${siteUrl}`);
    return null;
  }

  const metrics = cruxResponse.data.record.metrics;
  const report = {
    origin: siteUrl,
    timestamp: new Date().toISOString(),
    lcp: metrics.largest_contentful_paint?.percentiles?.[50] || null,
    inp: metrics.interaction_to_next_paint?.percentiles?.[50] || null,
    cls: metrics.cumulative_layout_shift?.percentiles?.[50] || null,
  };

  console.log(`CrUX data for ${siteUrl}:`, report);
  return report;
}

(async () => {
  const auth = new google.auth.GoogleAuth({
    keyFile: process.env.GCP_KEY_FILE,
    scopes: ['https://www.googleapis.com/auth/webmasters.readonly'],
  });

  const siteUrl = 'https://example.com';
  const report = await getCoreWebVitals(auth, siteUrl);

  if (report) {
    fs.appendFileSync('field-data.jsonl', JSON.stringify(report) + 'n');
  }
})();
Threshold-Based Alerting e Performance Budgets
Non voglio solo numeri — voglio decisioni automatiche. Ho definito performance budget per categoria di pagina:
// performance-budgets.json
{
  "budgets": [
    {
      "path": "/",
      "type": "homepage",
      "thresholds": {
        "lcp": { "good": 2500, "warning": 3000 },
        "inp": { "good": 200, "warning": 300 },
        "cls": { "good": 0.1, "warning": 0.15 },
        "fcp": { "good": 1800, "warning": 2500 }
      }
    },
    {
      "path": "/blog/*",
      "type": "article",
      "thresholds": {
        "lcp": { "good": 2500, "warning": 3200 },
        "inp": { "good": 200, "warning": 250 },
        "cls": { "good": 0.1, "warning": 0.15 }
      }
    }
  ]
}
Poi valuto ogni risultato di test contro il budget e genero un report:
// evaluate-budget.js
function evaluateBudget(testResult, budgetPath) {
  const status = { passed: true, violations: [] };

  ['lcp', 'inp', 'cls', 'fcp'].forEach(metric => {
    const threshold = budgetPath.thresholds[metric];
    if (!threshold) return;

    const value = testResult.metrics[metric];
    if (value > threshold.good) {
      status.passed = false;
      status.violations.push({
        metric,
        value,
        threshold: threshold.good,
        level: value > threshold.warning ? 'critical' : 'warning',
      });
    }
  });

  return status;
}
Real-World Troubleshooting: Quando i Test Falliscono
Ho affrontato diversi problema durante implementazione:
1. INP non disponibile nei lab test: Lighthouse usa Total Blocking Time come proxy per INP, non il valore reale. Soluzione: Lighthouse usa Total Blocking Time come proxy per First Input Delay, perché FID può essere misurato solo con real user data, mentre Lighthouse fornisce solo Lab Data. Ho aggiunto un fallback a campo metric audits, ma accetto che INP nel lab sia sempre un’approssimazione.
2. Variabilità fra run: Lo stesso URL può avere Lighthouse score diversi tra un run e l’altro. Soluzione: Puoi avere Lighthouse in verde e CrUX in rosso perché il tuo hosting ha picchi TTFB che il lab non cattura, o il contrario. Ho aggiunto multiple runs (3-5) e prendo la mediana, riducendo rumore.
3. Timeout di Chrome in ambienti containerizzati: Lambda a volte killava Chrome prima che Lighthouse finisse. Soluzione: ho aumentato timeout a 60 secondi e aggiunto retry logic con exponential backoff.
Integrazione Strumenti Esistenti
La mia pipeline si integra con articoli precedenti:
- WordPress WCAG 2.1 AA Compliance 2026: Lighthouse audita anche accessibility, quindi aggiunge data alle compliance checks.
- WordPress 7.1 RC1 Testing: Uso la stessa pipeline per testare responsive performance su nuovi blocks.
- Sustainable Hosting Architecture: Optimize performance riduce anche carbon footprint (meno CPU = meno energia).
Performance Optimization Tactics Basate su Dati
I tema e plugin WordPress frequentemente enqueuo CSS e JavaScript nel head che blocca il rendering — usa un plugin di performance per defer JavaScript non-critico e caricare CSS non-critico asincronamente. Nella mia pipeline, documento quali script/stylesheet bloccano il rendering per ogni URL tramite Lighthouse audit JSON, poi eseguo fix mirato.
Optimizzare immagini può migliorare LCP di 0.4-1.2 secondi, che spesso determina se un sito passa i threshold CWV di Google. Nel mio workflow post-Lighthouse, genero report di immagini non-ottimizzate e le compresso batch.
Se hai già ottimizzato immagini, installato caching, defer script e migrato su hosting decente, e LCP/INP sono ancora rossi, il sospetto è il tema — tre segnali: (a) PageSpeed riporta >200 KB di JavaScript inutilizzato dal tema; (b) Lighthouse attribuisce >2s al builder script; (c) homepage carica >15 stylesheet del tema. Ho automazione che riporta questi segnali.
FAQ
Quale è la differenza tra lab data (Lighthouse) e field data (CrUX)?
Lab data (Lighthouse) simula il caricamento di pagina in ambiente controllato con throttling fisso. Field data (CrUX) raccoglie metriche reali dai browser Chrome degli utenti. Lab è deterministico e utile per debug, field è la verità per rankings. Spesso differiscono: puoi avere Lighthouse verde e CrUX rosso se il tuo server ha TTFB variabile.
Devo testare su desktop e mobile?
Sì. Google usa mobile come primario per ranking dal 2021, ma desktop traffic non deve regredire. Nella mia pipeline testo entrambi, con config mobile prioritario (4G, CPU 4x slowdown).
Quanti threshold violation bloccano un deploy?
Dipende dalla policy. In staging, voglio strictness alta (zero violations su “good” threshold). In production, se è una change organica da traffico vero e field data è ancora in green, tolgo il blocco. Policy che sto testando: blocco solo su “critical” level (es. LCP >3s), warning su Slack ma non blocking.
ThresholdJS è uno strumento reale o custom?
Ho inventato il nome per il contesto di questo articolo — mi riferisco a qualunque framework di alerting basato su threshold numerici (Datadog, custom script, CloudWatch alarms). Se cerchi nome vero: Calibre, SpeedCurve, DebugBear sono SaaS; Grafana k6 è open-source per synthetic testing.
Come gestisco regression false positive (varianza naturale)?
Non blocco su singolo test. Eseguo 3-5 run e calcolo mediana. Imposto threshold warning 10% sopra il target good (es. good 2500ms, warning 2750ms). Solo violations su critical level bloccano CI.
Conclusione
Una pipeline automatizzata di performance testing per WordPress Core Web Vitals non è lusso — è necessità. Google non usa il PageSpeed score come ranking signal, usa i field data delle Core Web Vitals. Ma lab data mi dice cosa ottimizzare prima che impatti 28 giorni di metriche reali.
Nel mio workflow: Lighthouse in CI/CD (PR testing) + Synthetic monitoring continuo (30 min) + CrUX field data settimanale + Alerting threshold-based. Questo stack cattura regressioni in ore, non settimane, e mi permette di iterare performance con feedback loop veloce.
Se gestite WordPress multisite o ecommerce con migliaia di URL, scale questo approccio: distribuite Lighthouse runs in parallelo (Lambda concurrency), aggregrate risultati in dashboard centralizzato (Grafana + Prometheus), e definite budget per-template-type, non per singola URL.
Mandate mi commenti su quale tool di synthetic monitoring state usando, o se avete setup diverso — sempre utile comparare esperienze in campo.